畫時間位置圖
-
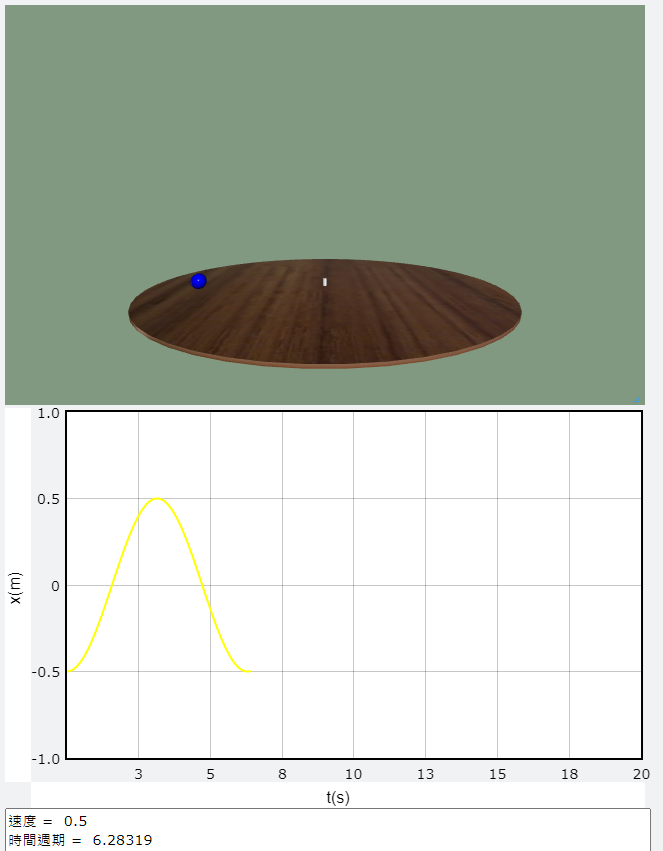
在上一個課程「等速率圓周運動」的案例中,我們使用的範例是讓「圓球」在「圓桌」上繞著「圓心」進行「等速率運動」,這個課程換成是將「等速率圓周運動」的資訊,畫出「時間位置圖」。
程式碼,如下:
Web VPython 3.2
# 匯入視覺化套件
from vpython import *

#  1. 畫面設定
# 畫布
scene = canvas(center=vector(0, 0.3, 0), background=vector(0.5,0.6,0.5))
# 位置圖
gd1 = graph(xtitle='t(s)', ytitle='x(m)', ymax=1, xmax=20, ymin=-1)
tx = gcurve(graph=gd1, color=color.yellow)
# 桌面
table = cylinder(pos=vector(0,-0.03,0), axis=vector(0,-0.01,0), radius=0.7, texture=textures.wood)
# 圓心
center = cylinder(pos=vector(0, -0.03, 0), axis=vector(0, 0.03, 0), radius = 0.007)
# 球
ball = sphere(pos=vector(-0.5,0,0), radius=0.03, color=color.blue)
#  2. 設定參數、初始值
ball.v = vector(0, 0, 0.5)
r = mag(ball.pos)
print("速度 = ", mag(ball.v))
print("時間週期 = ", 2*pi*r/ mag(ball.v))
# 時間間隔
dt = 0.001
# 經過時間
t = 0

#  3. 運動部分
while True:
    rate(1000)

    # 更新球的資料
    ball.a = - (mag(ball.v)**2 / r) * (ball.pos/r)
    ball.v = ball.v + ball.a*dt
    ball.pos = ball.pos + ball.v*dt

    # 畫出x軸位置圖
    t = t + dt
    tx.plot(pos=(t, ball.pos.x))
執行結果,如下圖:

課堂作業:
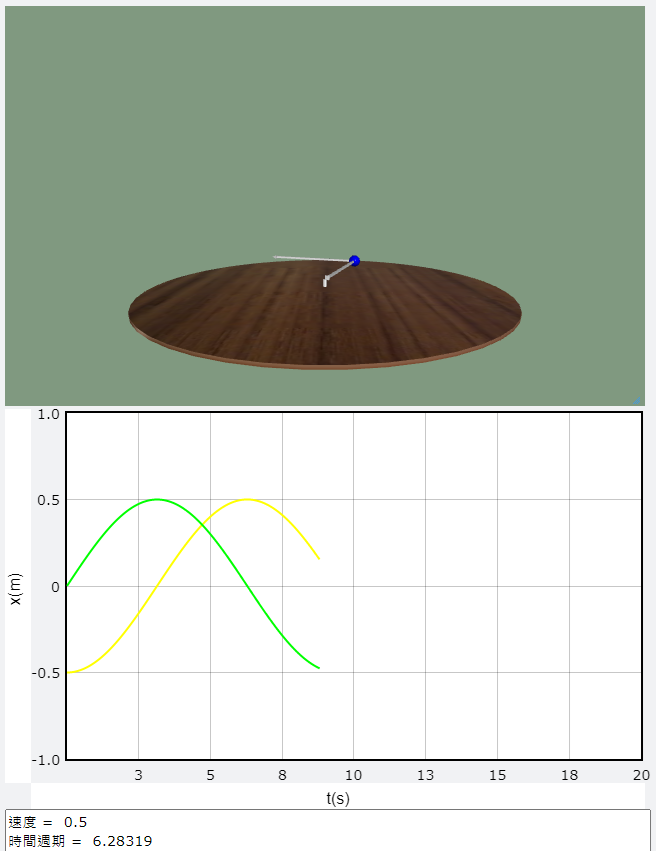
上面的範例是畫出「圓球」的「x軸」的時間位置圖,此堂課的作業是,除了原有的「x軸」的時間位置圖外,再加上「圓球」的「z軸」的時間位置圖,如下圖:

作業提示:
# 位置圖 gd1 = graph(xtitle='t(s)', ytitle='x(m)', ymax=1, xmax=20, ymin=-1) tx = gcurve(graph=gd1, color=color.yellow) tz = gcurve(graph=gd1, color=color.green) # 速度箭頭 v_arrow= arrow(pos=ball.pos, axis=ball.pos, shaftwidth=0.01) # 加速度箭頭 a_arrow= arrow(pos=ball.pos, axis=ball.pos, shaftwidth=0.01) # 3. 運動部分 while True: rate(1000) t = t + dt # 畫出x軸位置圖 tx.plot(pos=(t, ball.pos.x)) # 畫出z軸位置圖 tz.plot(pos=(t, ball.pos.z)) # 更新速度箭頭資料 v_arrow.pos = ball.pos v_arrow.axis = ball.v # 更新速度箭頭資料 a_arrow.pos = ball.pos a_arrow.axis = ball.a -