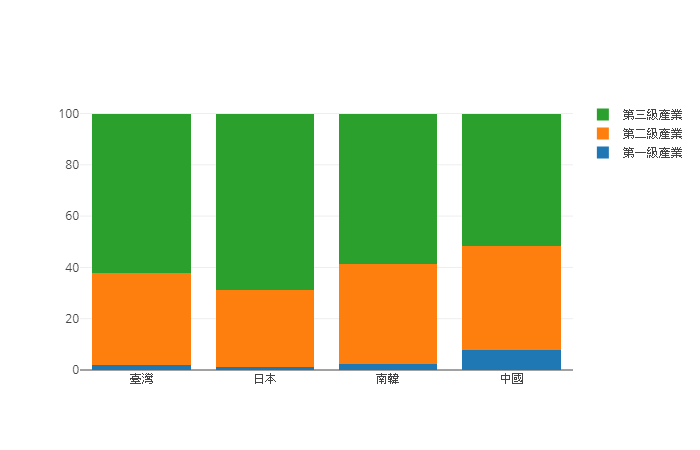
三級產業分佈
-
import pandas as pd
import numpy as np
import csv

country = ['臺灣', '日本', '南韓', '中國']

p1 = [1.8,1.1,2.2, 7.9]
p2 = [36, 30.1, 39.3, 40.5]
p3 = [62.1, 68.7, 58.3, 51.6]

# 匯入plotly套件,以便繪製視覺化圖形
from plotly.offline import download_plotlyjs, init_notebook_mode, plot, iplot
import plotly.graph_objs as go

trace1 = go.Bar(
    x = country,
    y = p1,
    name = '第一級產業'
)
trace2 = go.Bar(
    x = country,
    y = p2,
    name = '第二級產業'
)
trace3 = go.Bar(
    x = country,
    y = p3,
    name = '第三級產業'
)

data = [trace1, trace2, trace3]

layout = go.Layout(
    barmode='stack'
)

fig = go.Figure(data=data, layout=layout)

iplot(fig, filename='stacked-bar.html')
barmode
barmode=‘stack’
barmode=‘group’
barmode=‘relative’